Reviewing Patient’s Lab Results
When you need to review a patient’s laboratory results, the EHR provides a quick, streamlined way to access and explore everything you need in one place.
Note: At this stage, the View Lab Results (Beta) feature displays only lab results received electronically through the Lab Interface. Support for additional result sources will be added soon.
Step 1. Open the Lab Results Viewer
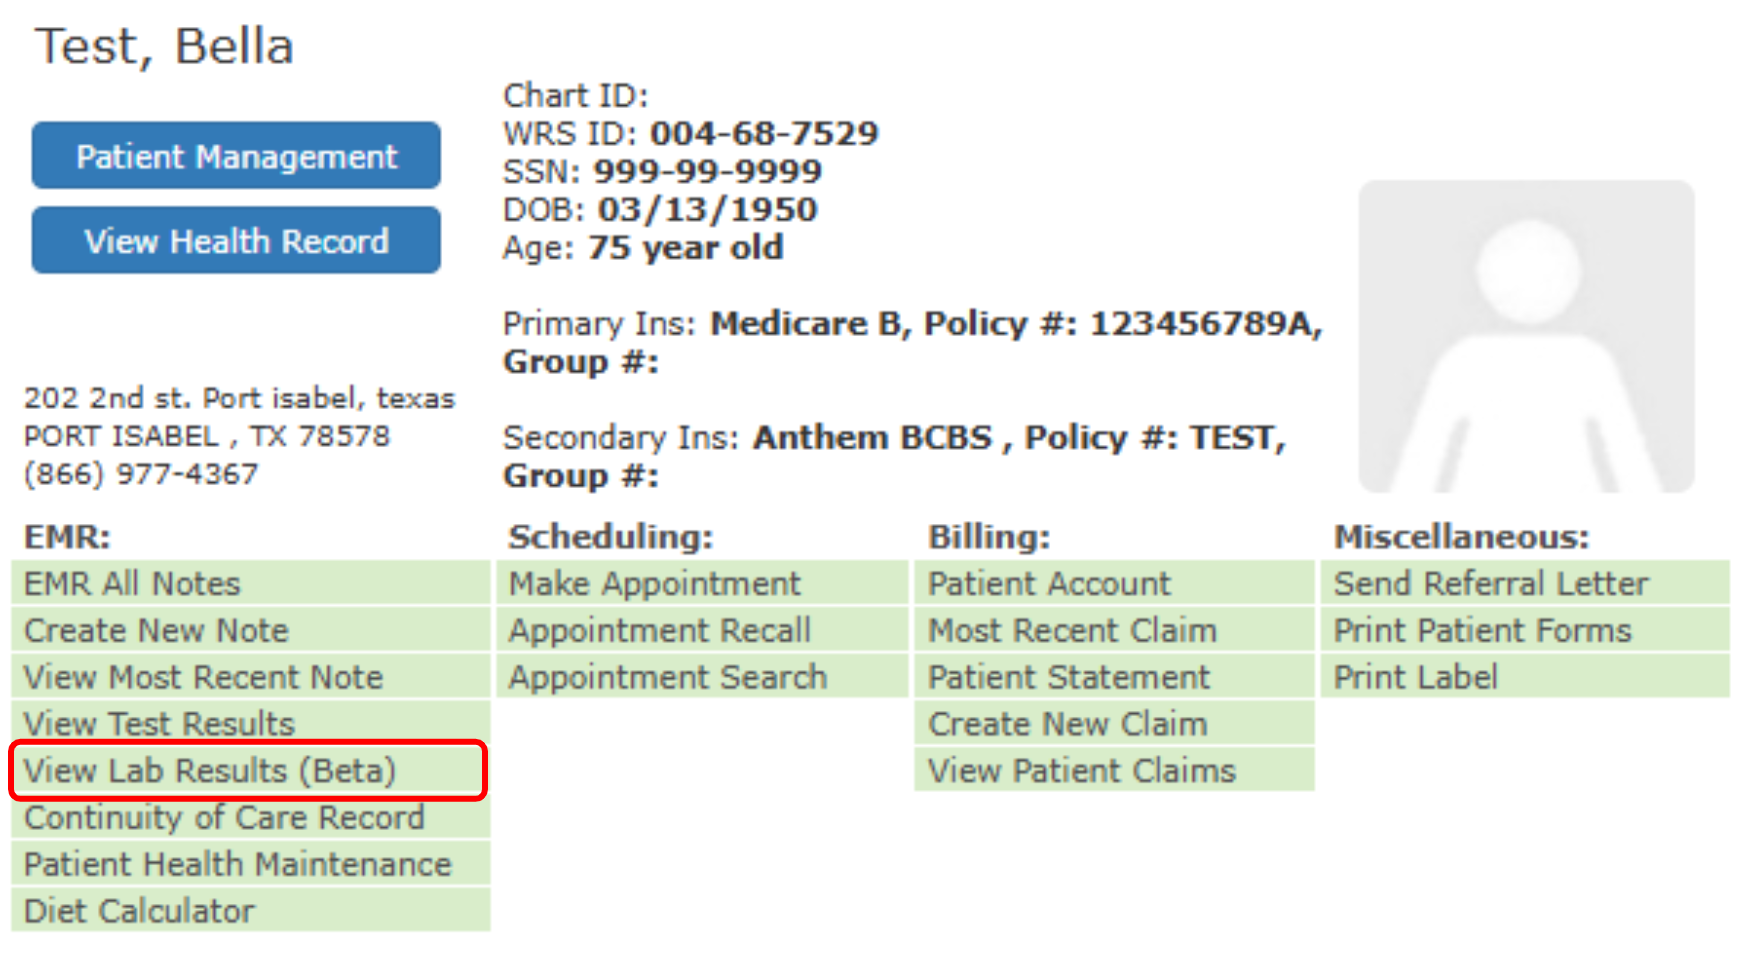
You can access a patient’s Lab Results page through several convenient entry points within the EHR:
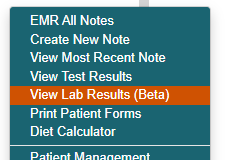
- From Today’s Appointment List: Hover over on patient’s name → View Lab Results (Beta)

- From Today’s Appointment List, or from Recently viewed patient: Right+click on patient’s name → View Lab Results (Beta)
- Search for a patient: Right+click on patient’s name → View Lab Results (Beta)

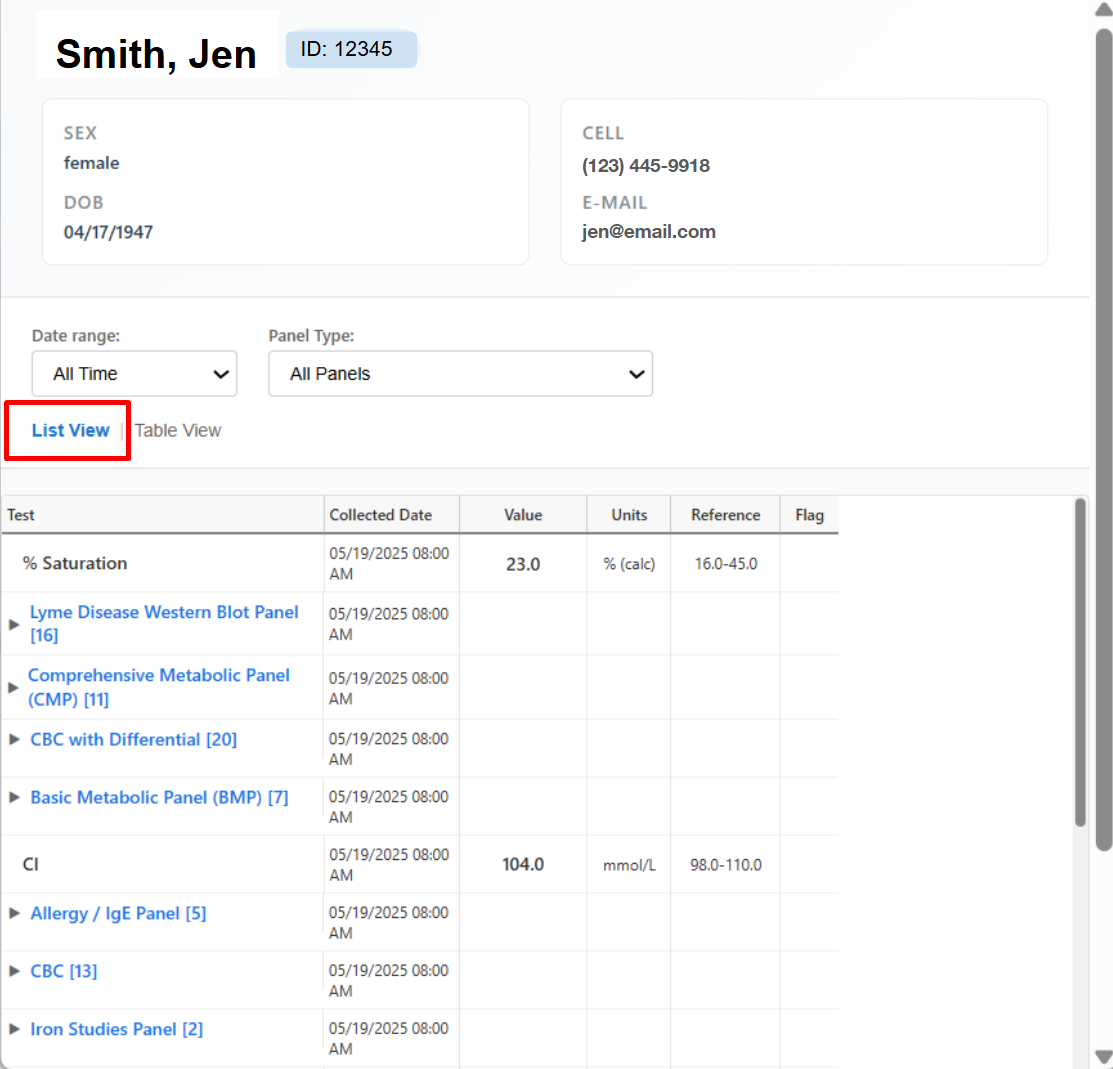
Step 2. Access the Lab Results Viewer Main Page
- The page opens in List View by default.

- In this view, tests are displayed by order date, which makes it easy to review what was performed during a specific visit or on a specific date.
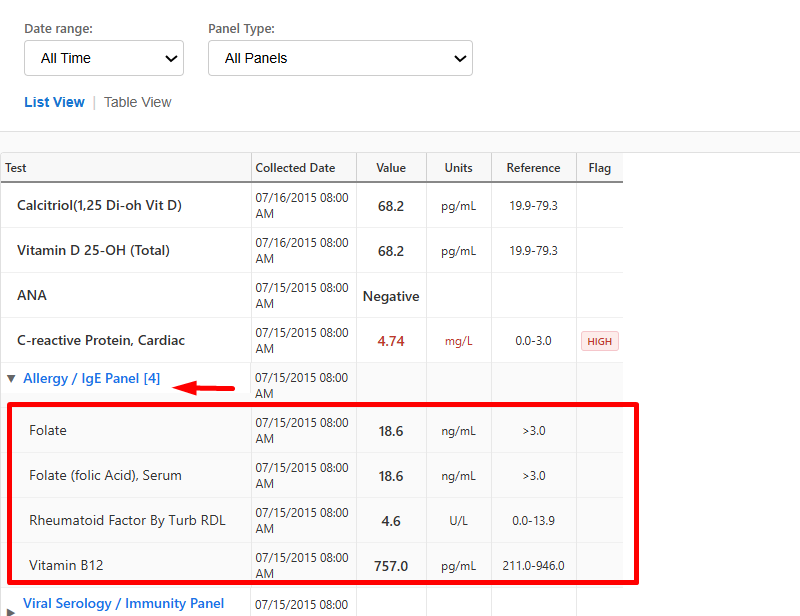
- Each panel is clickable and expands to show the tests under it, giving you a clear chronological view of results over time.
Step 3. Switch Views if You Prefer a Different Layout
- If you prefer to review results alphabetically by panel, you can switch to Table View using the toggle at the top.
- Table View groups tests by panel name, making it easier to quickly find a specific test or panel regardless of when it was performed.


Step 4. Narrow the Results Using Filters
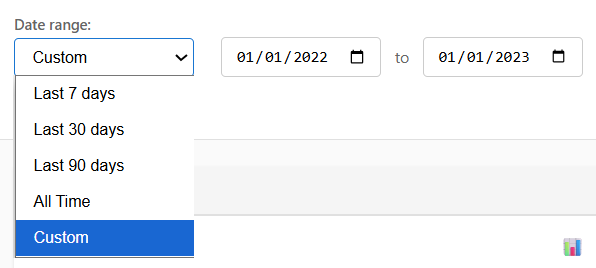
Use the Date Filter
- If you’re looking for results within a certain timeframe — for example, the past week or month — open the Date Filter and pick a preset range or choose a custom date span.
- The list will update right away.

Use the Panel Filter
- If you want to focus on a particular group of tests ( i.e. CBC with Differential ), open the Panel Filter and select the panel you want.
- Only the tests from that panel will appear. You can even combine both date and panel filters for a more focused review.


Step 5. View Trends using Graph
- If you need to see how a specific test has changed over time, click the –
 Graph Icon next to the test.
 - A chart will appear showing the results across different dates.

- Hover over any point to see the exact value and date.
- Normal and abnormal results are highlighted with different colors.
- You can move across the graph, with either vertical or horizontal scroll to view longer timelines.
- A table below the graph also lists the same values organized by dates for quick reference.

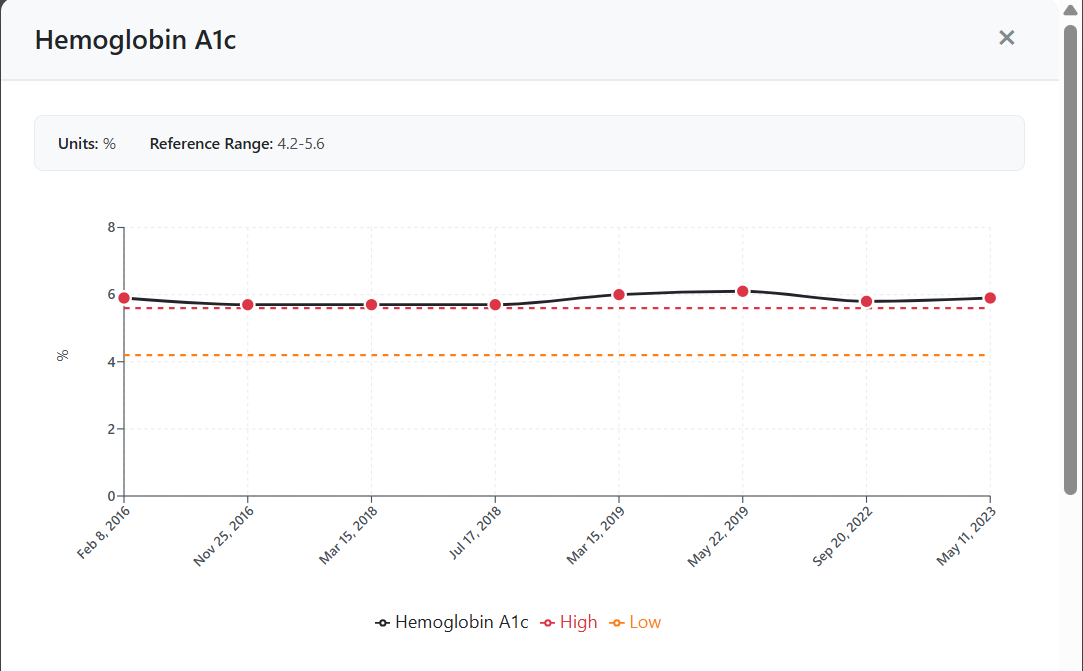

Step 6. View Full Result Details
- Whenever you need more detail about a specific test, just click the row or the test name.
- A pop-up window will appear showing details about that test, including units, reference ranges, and the exact date it was recorded.


You’re Done!
This step-by-step process helps you quickly locate lab results, filter what you need, and interpret values visually or numerically — all within a single streamlined viewer.

Still no luck? We can help!
Contact us and we'll get back to you as soon as possible.
Submit a Request