
Business Intelligence Dashboards
Navigation & Usage Guide
Recognizing the need for more intuitive and accessible information, the EHR system has been enhanced with interactive analytics dashboards. These dashboards provide clear, actionable insights to support informed decision-making and improve overall practice performance.
Available Dashboards
- Billing Insights
Gain visibility into your financial performance, track revenue cycles, and optimize profitability. - Scheduling Insights
Improve staff productivity and reduce downtime with detailed scheduling insights. - Demographics Insights
Understand your patient population, identify growth opportunities, and tailor services effectively. - Clinical Insights
Gain deeper visibility into patient care and clinical performance through real-time data, enabling smarter decisions, improved outcomes, and more efficient workflows.
Accessing Insights Dashboards
To access dashboards within your practice, you must first be granted access by your EHR system administrator. Once permissions are assigned, the dashboard menus will become available in your account.
Steps
- Login to your EHR.
- Navigate to the Business Intelligence menu, then select any of the dashboards available from the dropdown.


The selected dashboard will open on the main dashboard page.
Navigating Dashboard Features
Each dashboard is composed of the following components:
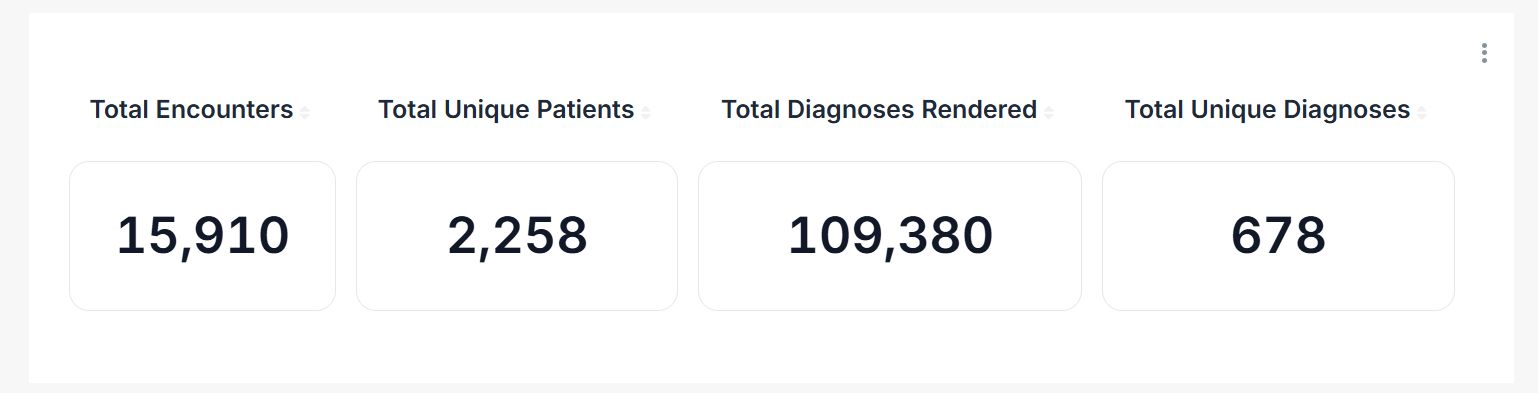
- KPI Cards
Display high-level metrics and key performance indicators at a glance.

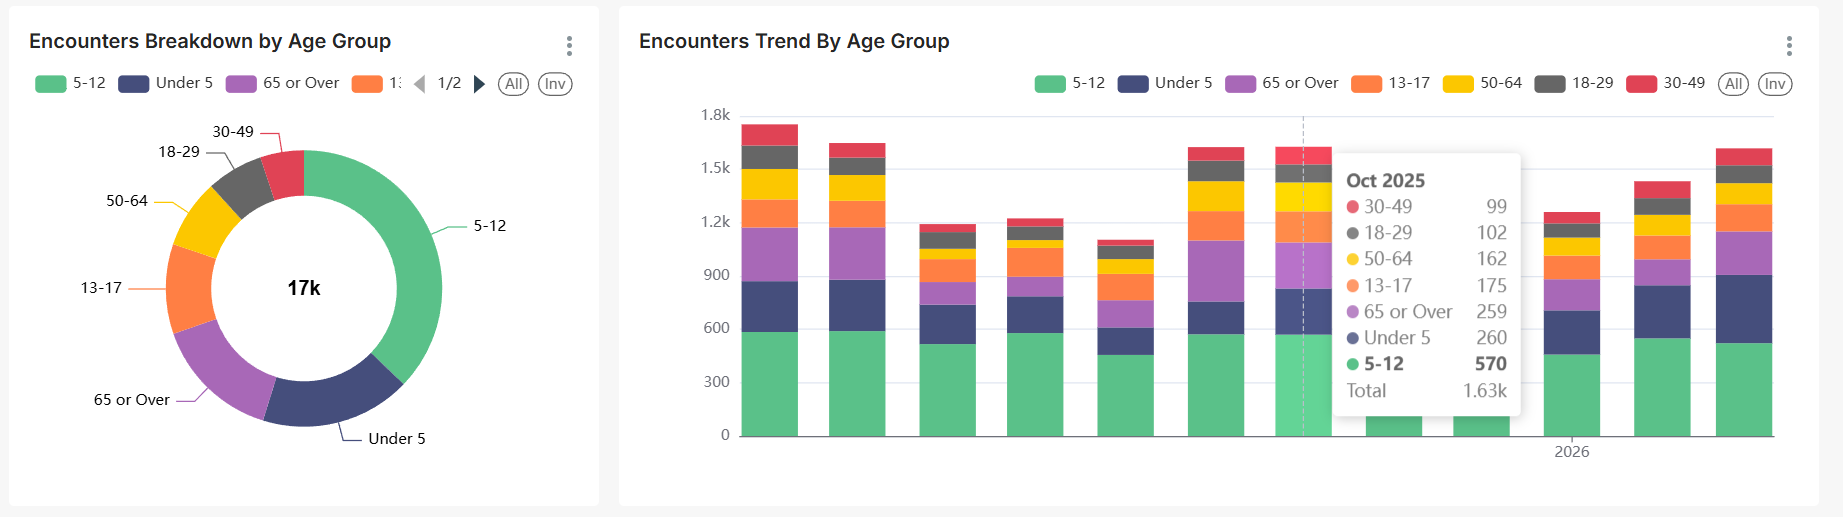
- Charts & Graphs
Provide visual insights such as trends, comparisons, and data breakdowns.

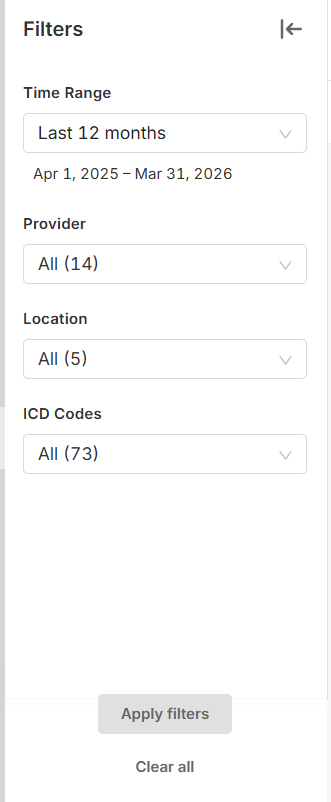
- Filters
Allow you to control and refine the data displayed across the dashboard.

Using Filters
Filters help you customize the data view based on your needs.
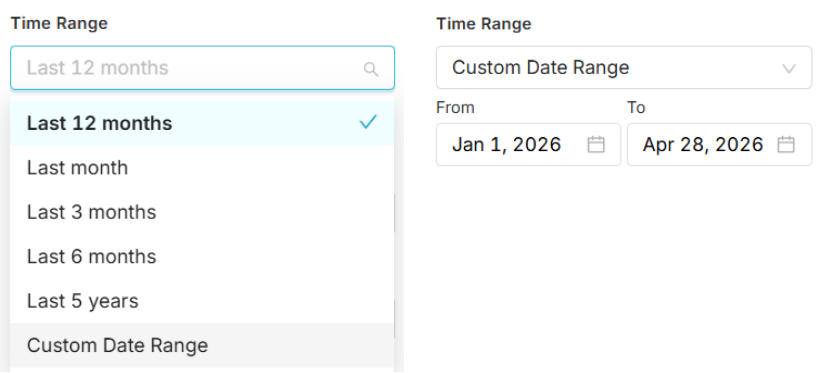
Time Range Filter
- Select a predefined time period or define a custom date range.
- Changes are applied instantly—no need to click Apply Filters.

Other Filters
Examples include:
- ICD
- CPT
- Provider
- Location
- Payor
- Patient Status
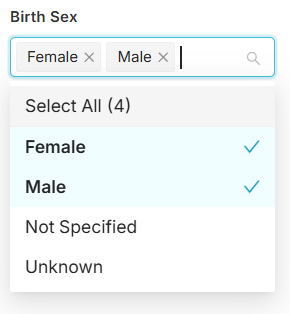
You can:
- Select all options
- Or choose specific values to narrow results
Apply & Clear Filters
Examples include:
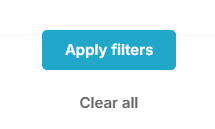
- Apply Filters
Required for all filters except the Time Range filter. - Clear All
Resets all separate filters to their default state.
Dashboard Actions & Controls
Chart Menu Options
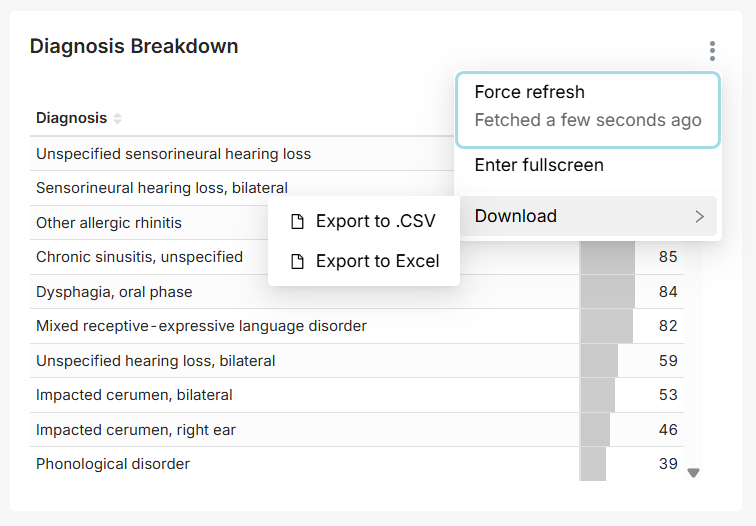
Each chart includes a menu  with the following actions:
- Zoom into chart data
- Refresh data
- Download data (CSV or Excel)
Fullscreen Mode
- Click Enter Fullscreen to expand the dashboard view or display to fit into your screen.
- Click
 to exit fullscreen


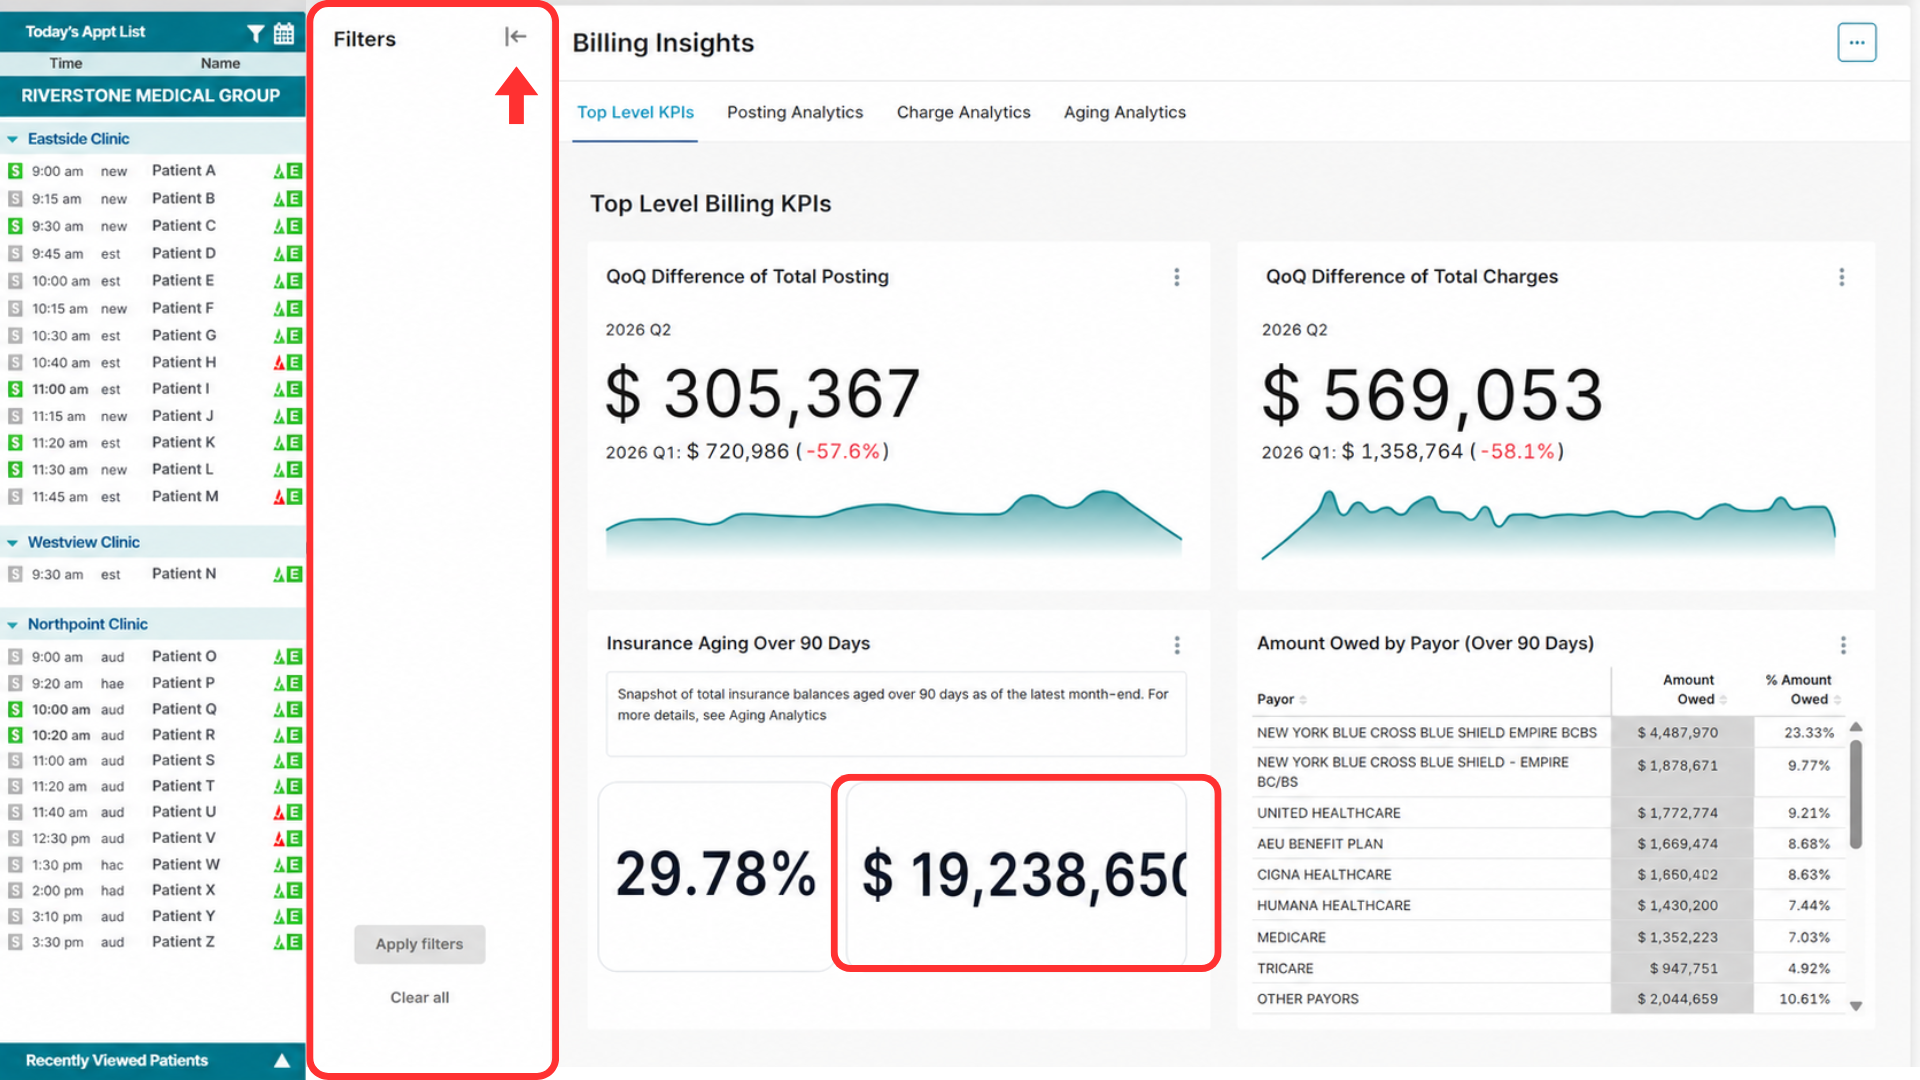
Collapse the left filter pane
Use the collapse  option on the filter panel to hide the filters and expand the dashboard viewing area. This gives more space to view KPI cards, charts, and full metric values.
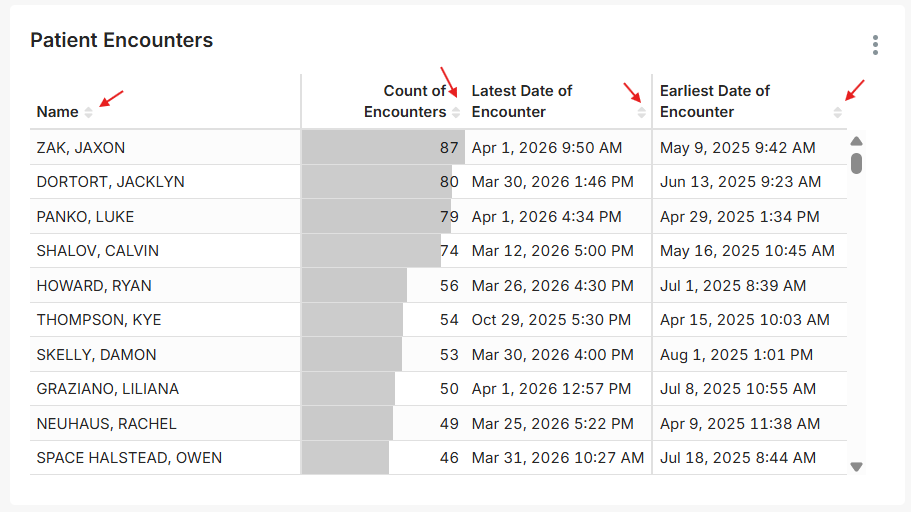
Working with Tables (Pivot Tables)
For data represented with pivot Tables:
- Click the sort icon beside a column header
- First click → Ascending order
- Second click → Descending order
Interacting with Dashboards
- Hover for details
Move your cursor over charts to view exact values and additional data. - Click to drill down (if enabled)
Click on chart elements (bars, lines, segments) to explore more detailed data. - Use filters together
Combine multiple filters (e.g., Provider + Location + Time Range) to refine results. - Reset when needed
Use Clear All to quickly return to the default view. - Refresh data
If the dashboard appears outdated, use the refresh option in the chart menu.
Still no luck? We can help!
Contact us and we'll get back to you as soon as possible.
Submit a Request